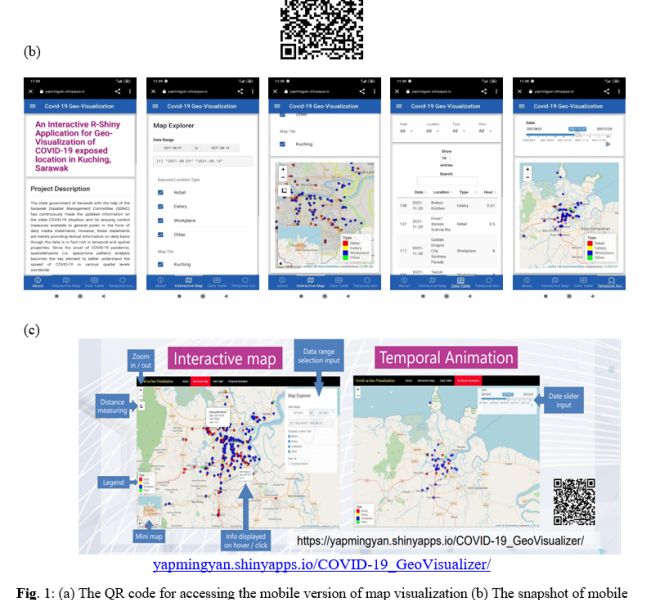
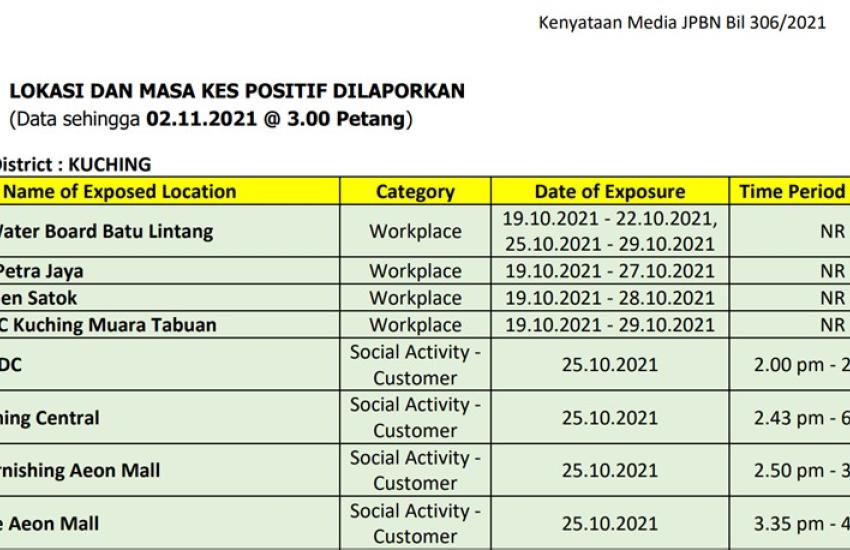
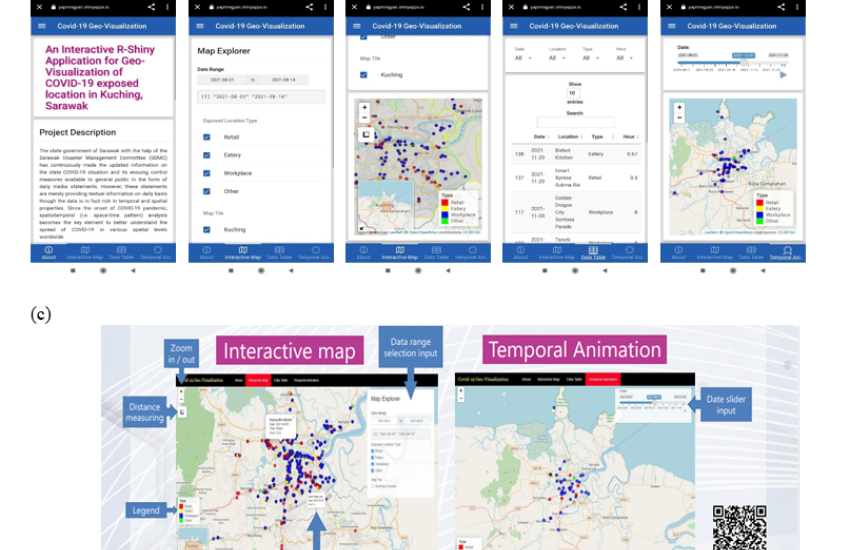
Various forms of contact tracing had been employed by public health authorities worldwide in COVID-19 pandemic, which include manual approach and technology-assisted forms to uniquely identify the possible contacts for an infected individual. Another different type of contact tracing identify locations that an infectious person has visited. Particularly, a bulletin board style approach is used to notify the public on the possible exposed locations. The general public are advised to regularly check the bulletin boards for locations of interest to them, and individuals who have been to these locations during the same time frame are encouraged to monitor their health. This form of bulletin board contact tracing was employed by the Sarawak Disaster Management Committee (SDMC) as one of the control measures in combating the disease. In the year of 2021, SDMC continuously published list of location visited (such as workplace, eatery, retail store) by infectious individuals in major districts through daily press statements. Although the list of such locations only covers a very small subset of COVID-19 patients within the districts, it is found that the correlation between the number of locations listed and the average number of daily confirmed cases is moderate strong, with r = 0.693 [1]. This suggest that the data should be further explored to gain better insights on the geographical and temporal distribution of COVID-19 transmission in Sarawak, as these data are rich in temporal and spatial properties. However, the list of locations published in the SDMC daily press statements are in static textual form and solely in daily basis. Therefore, we applied both the geo-visualization techniques and geospatial statistical analysis to these data. Specifically, we retrieve the textual information from daily press statements, geocode the locations and develop a web application using RShiny to geo-visualize the data. The web application consists of three main modules. The first module is an interactive map where public can visualize all the exposed locations in certain date range, with spatial resolution up to street level. The locations are further sub-divided into different types such as workplaces, eatery, retails and other, which may be useful for further geo-statistical analysis. The details of the location points are also provided when user hover the point. The second module gives the details of the selected location downloadable as an excel file. The third module presented the list of exposed locations in temporal animations. Apart from Rshiny web application (URL: yapmingyan.shinyapps.io/COVID-19_GeoVisualizer/), it is also available in mobile interface so that users can also interact with the map effectively using mobile devices, which can be accessed via QR code in Fig. 1(a). Being able to visualize the list of location visited by COVID-19 patient prior to being tested positive help general public to be more aware how infectious the virus is from a map perspective. This first ever construction of map visualization for Sarawak COVID-19 exposed location can play a significant role in assisting our public health authorities in combating the infectious diseases transmission at the district level in Sarawak.


Comment